ACE Sidecar: Real-Time Observability and Telemetry for AI Coding Agents
A local proxy for AI coding agent workflows providing real-time cost attribution, execution latency analysis, and empirical optimization metrics without data exfiltration. Available in public beta.
We measured one developer's Claude Code sessions request by request over five weeks and published the results: 4.2 billion prompt tokens, $3,035 at list price, 90.5% of it input that had already been sent, and a set of optimisation levers whose measured value diverged from their estimated value.
The instrument used for that measurement is now available to run.
The ACE sidecar is a local reverse proxy between a coding agent and the model provider. It relays traffic unchanged, prices every request, reads existing transcripts off disk, and renders the result on a loopback-bound dashboard. No account, no upload, and one environment variable to point an agent at it.
// sidecar_beta
Get beta access
The sidecar runs entirely on your machine and uploads nothing. Leave an address and we'll send you the build and the quickstart when the beta opens — or just to stay in the loop.
We use it to send you the beta and nothing else. Unsubscribe in one click.
What it shows
The screenshots below are rendered from real session data. Paths, project names, prompts and session identifiers have been replaced with synthetic equivalents; the aggregate numbers are untouched.
Fleet metrics
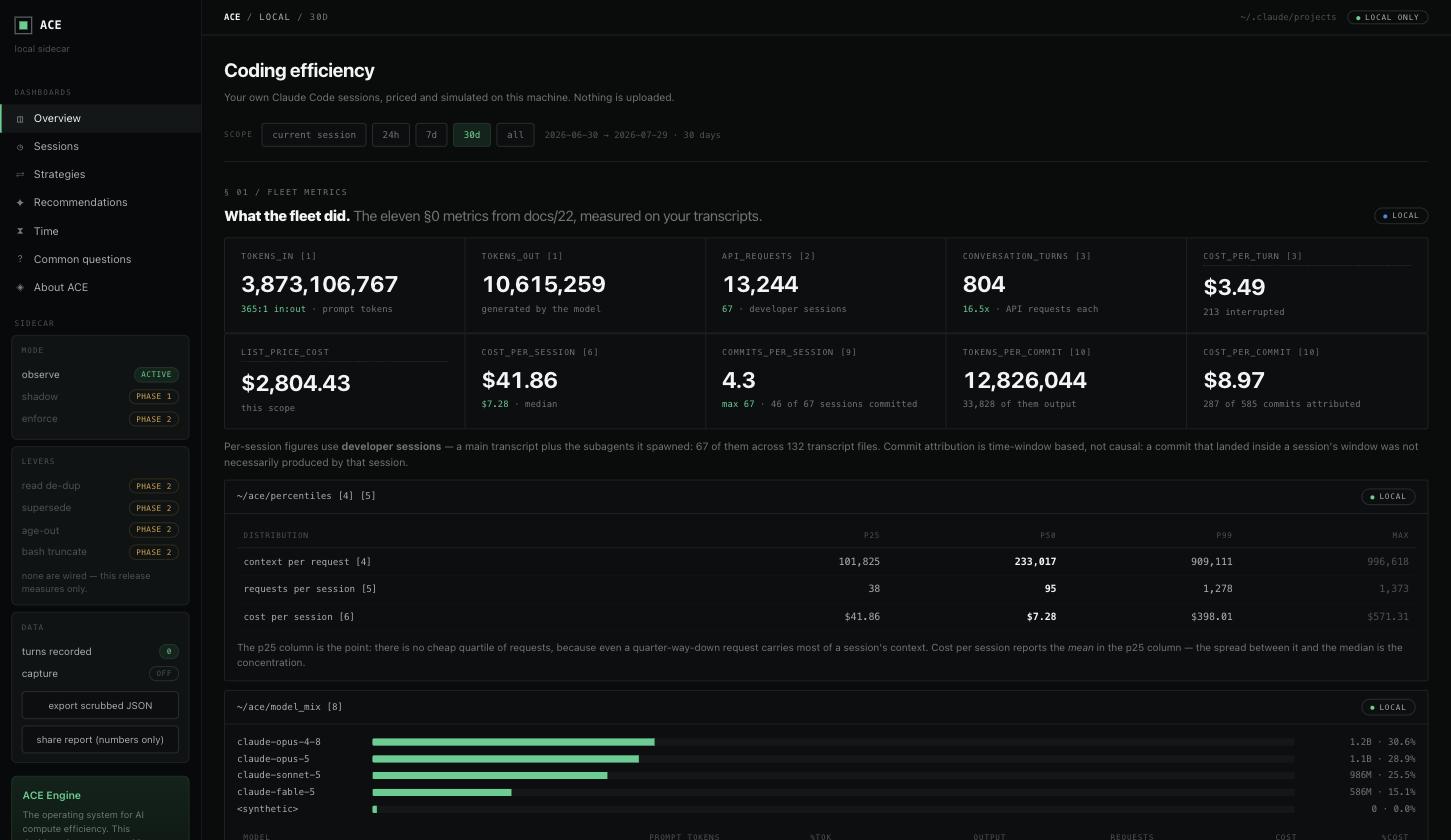
Tokens in and out, requests, handbacks to the user, cost per turn, cost per session, commits per session, tokens per commit. In the distribution table underneath, the p25 request already carries 100k+ tokens of context — the distribution has no cheap quartile, which is what separates context-size work from per-request payload tuning.
Commit attribution is time-window based and is labelled as such on the page: a commit that landed inside a session's window was not necessarily produced by that session.
Activity over time
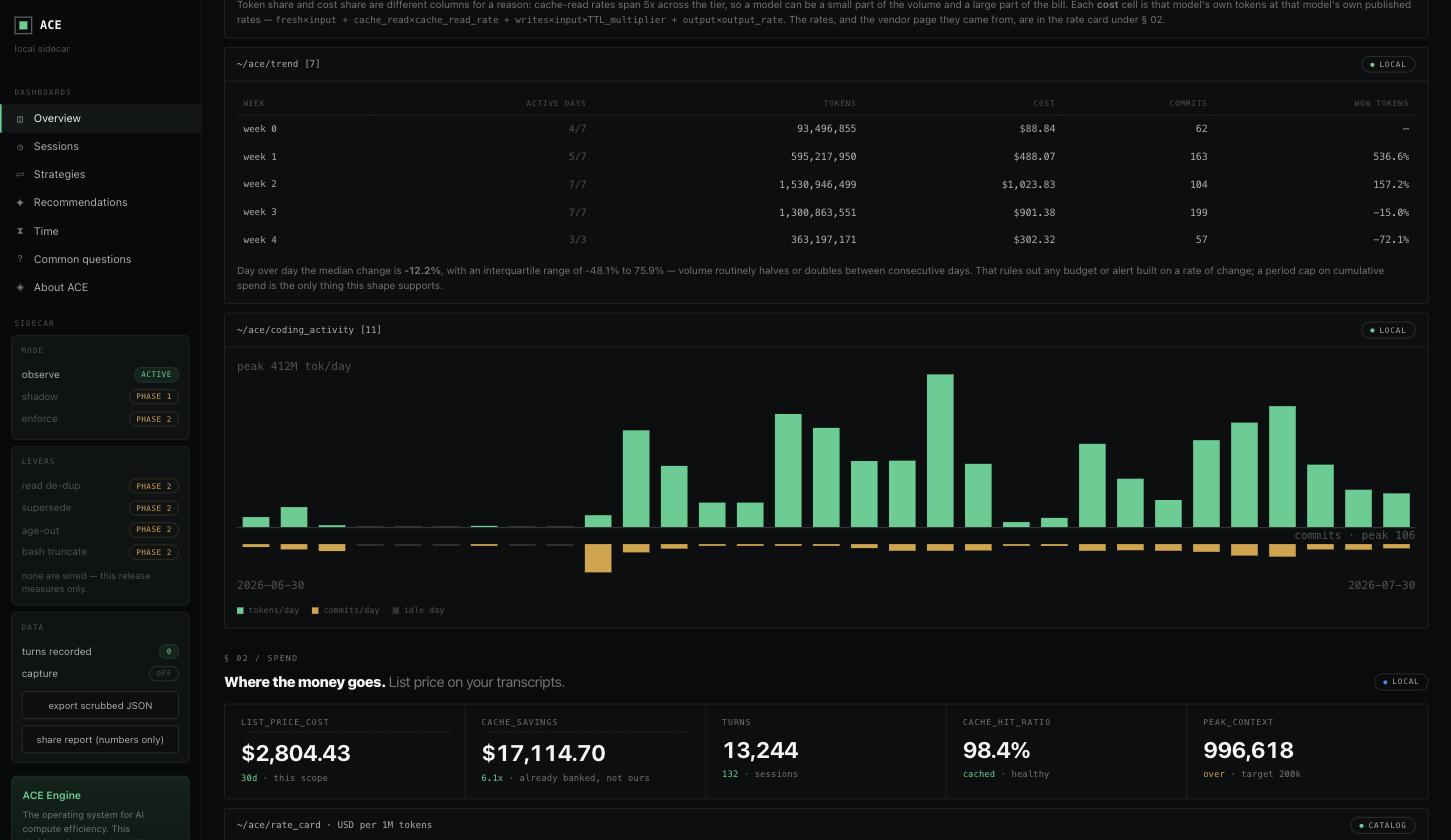
Daily tokens, daily commits, idle days. On this corpus the day-over-day median change is −12.2% with an interquartile range of −48% to +76% — within the middle half of days, volume halves or doubles between consecutive days.
At that dispersion, a threshold on rate of change fires on ordinary variation. A cumulative cap against a period budget does not.
Spend, with the rate card attached
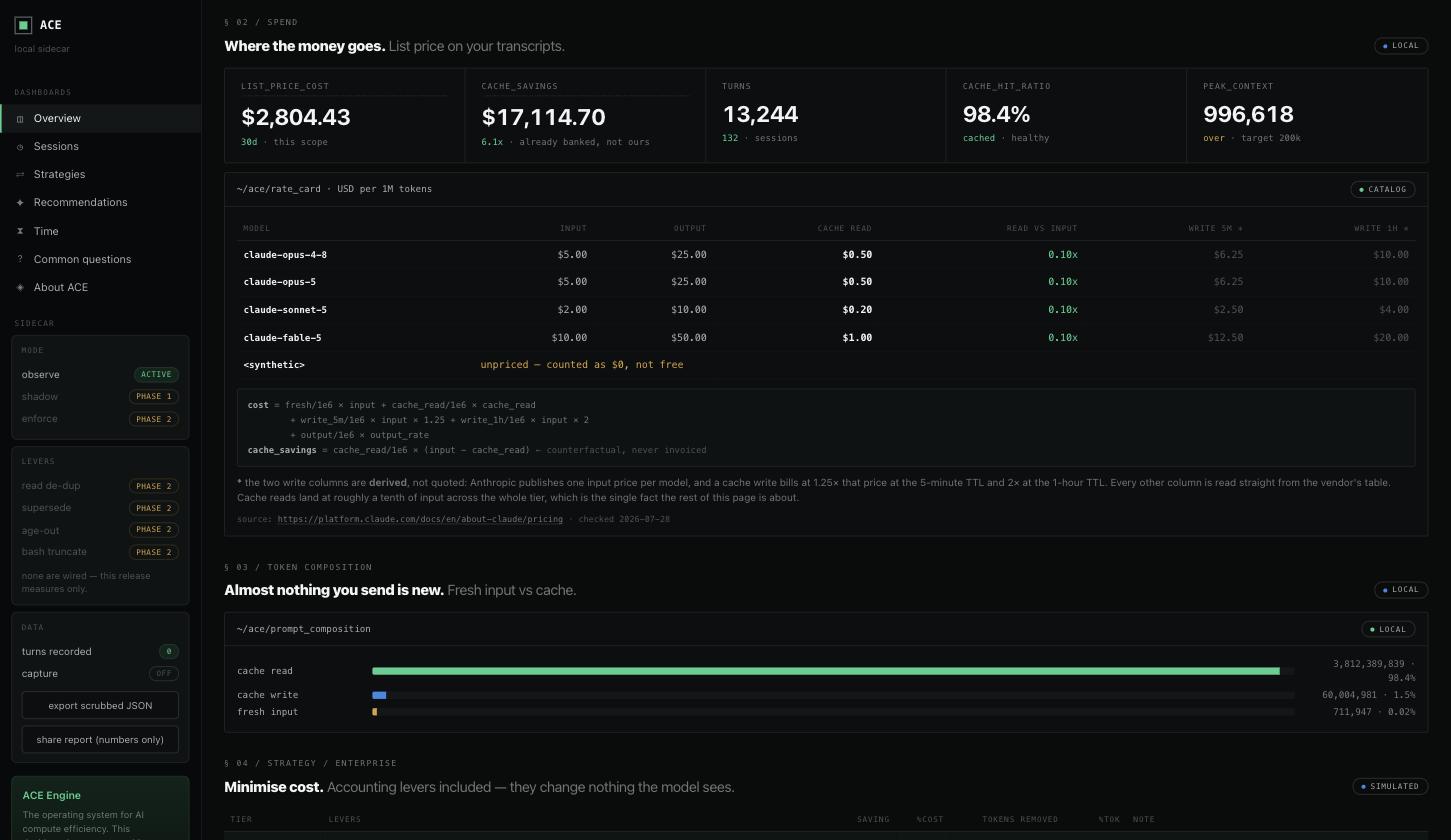
Cost, cache savings, cache hit ratio and peak context, followed by the per-model rate card and the cost formula. Every rate is read from a versioned catalog and links to the vendor's pricing page with the date it was checked.
Two figures stand out. Cache savings are larger than the bill — 6.1× on this corpus — and that saving is the provider's, banked before the sidecar enters the path; the dashboard labels it that way rather than claiming it. And cache reads are ~98% of prompt volume.
Lever scorecards
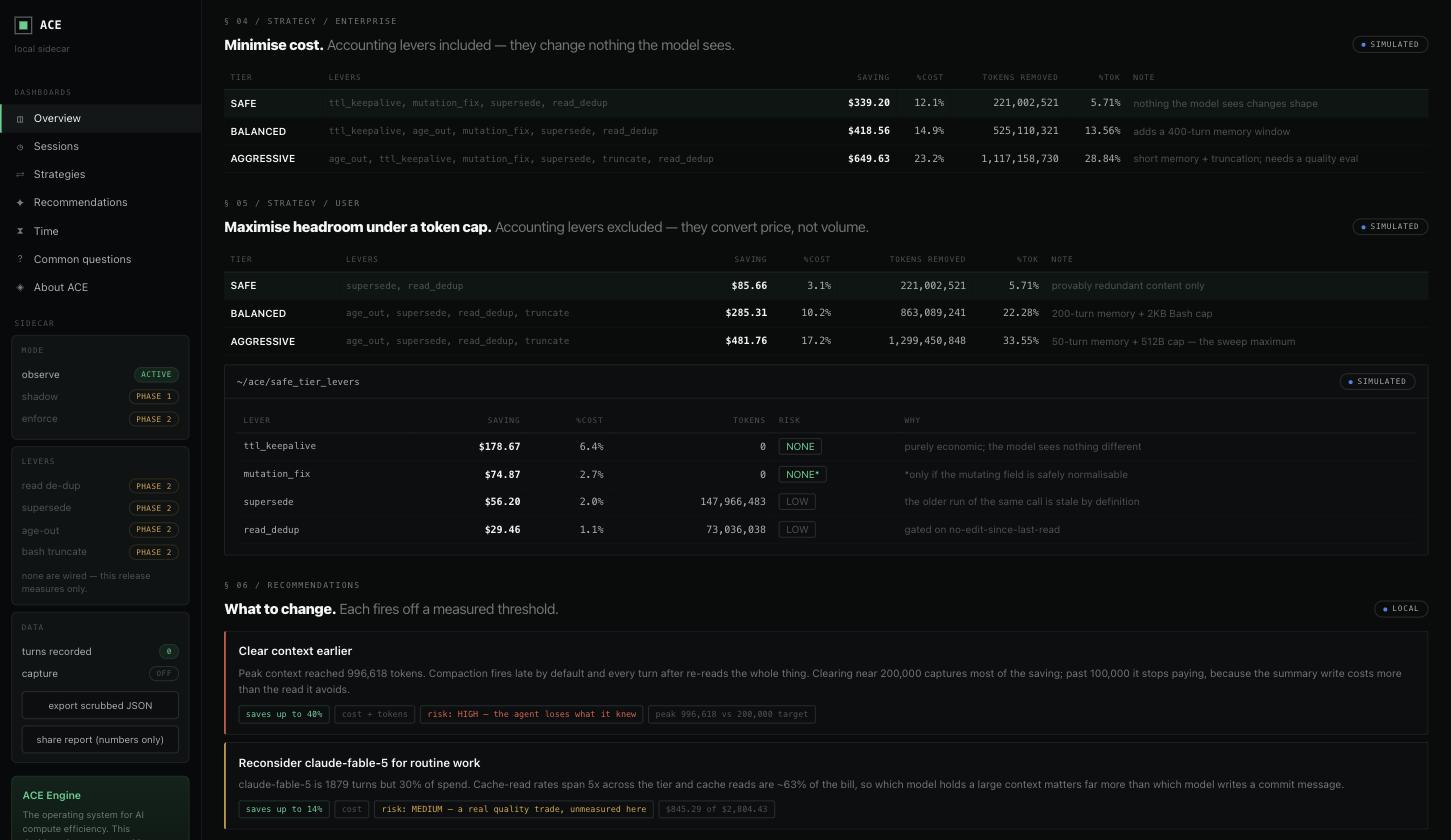
Two scorecards, for two different objectives:
- Enterprise — minimise dollars. Accounting levers count, because they change nothing the model sees.
- User — maximise headroom under a token cap. Accounting levers are excluded, because they convert price without removing a token.
The per-lever table carries a risk column. On this corpus the largest lever
(ttl_keepalive, 6.4% of cost) removes zero tokens, while the levers that do remove tokens are
smaller. Everything simulated is badged SIMULATED, so a modelled result is never presented as a
measured one.
Sessions
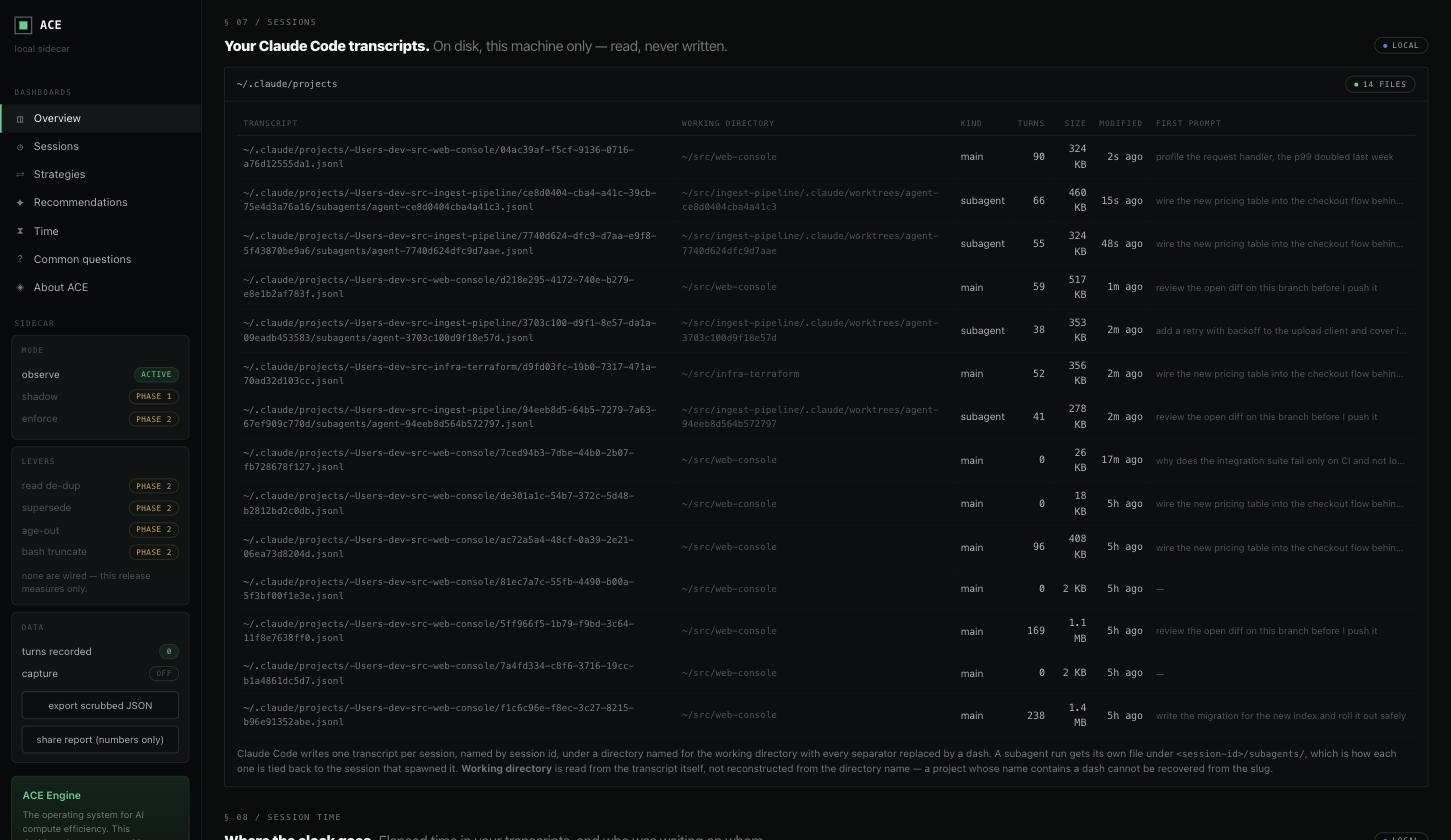
The transcripts the numbers came from — main sessions and the subagent runs they spawned, with turn counts, sizes and the first prompt of each. Working directory is read from the transcript itself rather than reconstructed from the directory name, because a project name containing a dash cannot be recovered from Claude Code's slug.
Session time
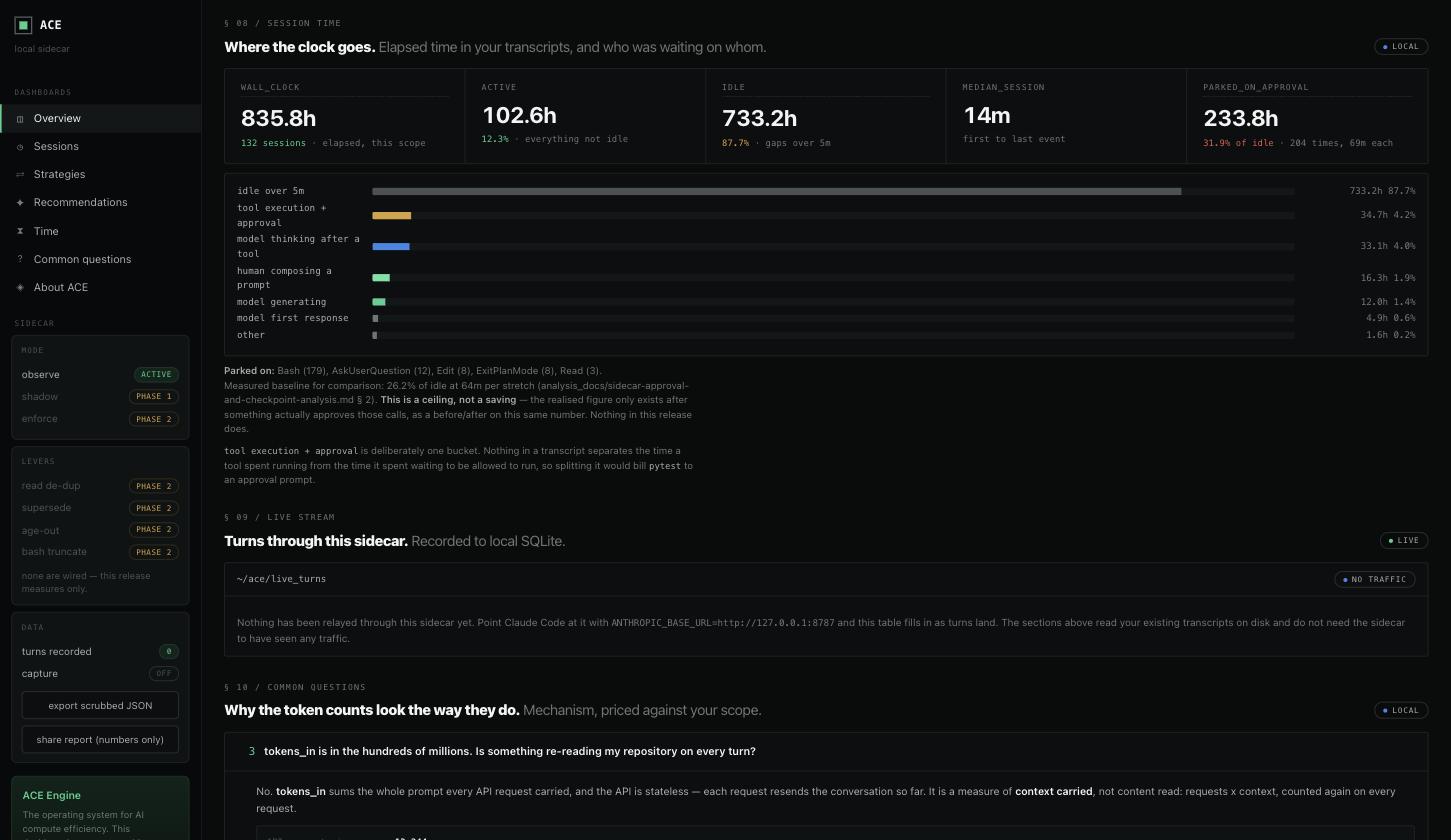
Elapsed time decomposes differently from cost: 87.7% of wall clock is idle, and 233.8 hours of that — 204 occurrences, 69 minutes each — was an agent holding a pending tool call. The dashboard raises pending tool calls as a live alarm; the detection is a state check on the transcript, not a classifier.
The figure is labelled a ceiling, not a saving. A transcript cannot distinguish a human who would have returned sooner from one who was away regardless, so the reported number is the upper bound.
What it does not do
It does not upload anything. Not prompts, paths, code, session identifiers, or telemetry. The sidecar reads the local transcript directory and writes a local SQLite file. There is no account, no ACE-side API key, and no network destination other than the model provider already being called.
It does not change traffic. This release is measurement only: it relays requests unchanged and
reports "levers": [] on its health endpoint. Optimisation levers ship in later phases, in shadow
mode before enforcement.
It does not hold credentials. ace up --no-key stores nothing and relays whatever the caller
sends, which is what a subscription client requires. It binds to loopback and rejects requests
carrying proxy headers, so a non-loopback address returns 403 rather than acting as an open relay.
It does not claim the provider's savings. Prompt caching had already banked a 6.1× saving on this corpus. The dashboard shows it, labels it, and excludes it from every scorecard.
It does not auto-approve tool calls. Permission decisions never traverse the API: the model
emits a tool_use block and the client decides locally whether to prompt, so a proxy on
/v1/messages is not in that loop. Claude Code ships an auto-approver in auto mode; what auto
mode does not report is a number for what it approved, blocked, or saved. That is what the session
time section measures.
Running it
Install the package to get the ace console script, then:
ace up --no-key # subscription (OAuth) clients — the common case
The banner prints where everything lives:
  ACE sidecar → https://api.anthropic.com
  auth: loopback-trust · credential: caller-supplied · levers: none (Phase 0)

  Point your agent at it:

      export ANTHROPIC_BASE_URL=http://127.0.0.1:8787

  Dashboard: http://127.0.0.1:8787/dashboard
  Health:    http://127.0.0.1:8787/healthz
  Telemetry: ~/.ace/telemetry.db  (local SQLite, never uploaded)
Then, in the shell that runs the agent:
eval "$(ace env)"
claude
The historical sections read transcripts already on disk, so fleet metrics, spend and the time budget are populated before the sidecar has relayed a request. Live turns appear as they land.
GET /api/report returns a scrubbed JSON summary: aggregates only, no per-session detail, no
prompts, no paths, no identifiers.
What ships next
Everything before the last item is read-only.
| # | Work | Rationale for the position |
|---|---|---|
| 1 | shipped — the data was already in hand | |
| 2 | shipped — 233.8h; no classifier required | |
| 3 | Per-turn risk colouring, in shadow | read-only; accumulates real refusals to validate against |
| 4 | Shell segment parser | the 44.5% of calls no classifier can currently read |
| 5 | Allowlist rule generator | deterministic; complements auto mode rather than duplicating it |
| 6 | Context-exhaustion forecast + local checkpoint | zero wire impact; survives the session |
| 7 | Bash truncation with head+tail retention |
the first lever that changes a byte — measured at ~1.7% of cost, low risk |
Item 6 was scoped by the corpus. The assumed trigger was usage-limit exhaustion; across 162 sessions there were 3 rate-limit errors. Context exhaustion is the event that occurs, and auto-compaction already handles it in-band. What compaction does not provide is durability — its summary is in-context and lossy, and ends with the session — so the feature is a resume brief written to disk.
Item 7 was initially rated high-risk on the grounds that Bash output carries diagnostics such as
stack traces and test failures. Splitting the recovered value by whether the output contains a
diagnostic showed 90% of it is sed/cat dumps, grep roll-ups and git diffs read once.
Retaining head and tail and exempting the diagnostic class recovers most of the value at
correspondingly lower risk.
The lever originally scheduled first — collapsing duplicate file reads — measured $0.33 across 36 days, because 97.6% of "repeat reads" request a different line range and are not duplicates. It was dropped. The measurement is in the analysis post.
The beta
The sidecar runs locally, uploads nothing, and works with Claude Code today. Access opens in batches.
The most useful thing a beta user can contribute is a second corpus. Every finding above comes from one developer on one machine over 36 days: the cost structure may generalise, but the magnitudes are one fleet's and are unverified elsewhere.
Leave an address below and we will send the build and the quickstart when your batch opens.
// sidecar_beta
Get beta access
The sidecar runs entirely on your machine and uploads nothing. Leave an address and we'll send you the build and the quickstart when the beta opens — or just to stay in the loop.
We use it to send you the beta and nothing else. Unsubscribe in one click.