Empirical Analysis of 13,000+ AI Coding Agent Sessions: Cost and Efficiency Lessons
Empirical breakdown of 12,902 requests across 4.17B tokens and $3,035 spend: evaluating prompt caching efficiency, context duplication (90.5%), and transcript telemetry.
The corpus: 121 transcripts — 47 developer sessions plus the 74 subagent runs they spawned — 12,902 API requests, 4.17 billion prompt tokens, $3,035.09 valued at Anthropic list price. Every figure below is reproducible by re-running the scripts against the same committed dataset.
1. Traffic shape: input dominates
| Direction | Tokens | Share of input |
|---|---|---|
| Fresh input | 1,067,321 | 0.03% |
| Cache read | 4,096,550,551 | 98.33% |
| Cache write | 68,326,182 | 1.64% |
| Input total | 4,165,944,054 | |
| Output | 10,721,571 | — |
Input outweighs output 389 : 1 — 322,890 tokens in and 831 out per request.
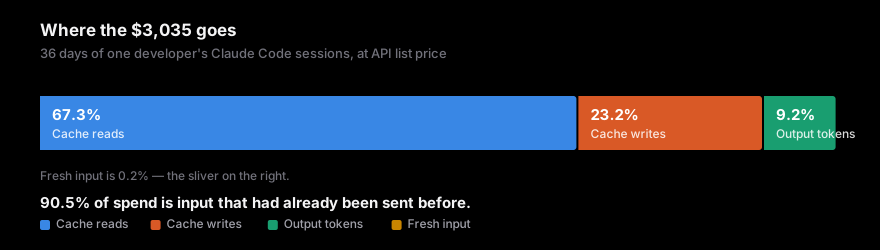
90.5% of spend is input that was already sent before — re-read from cache, or written into it. Output is 9.2%. Fresh input is 0.2%.
Three consequences follow arithmetically:
- Prompt compression has a 0.2% ceiling. A compressor that eliminated all fresh input cuts the bill by 0.2%; one that touches the cached prefix busts the cache and raises cost.
- Output-token optimisation addresses 9.2%. Shorter responses,
max_tokenscaps and cheaper output tiers all divide that share; 90.8% sits in context handling. - Prompt caching has already banked a 7.1× saving — $18,393 of avoided cost — before any additional lever applies.
2. Cost is context size × turns
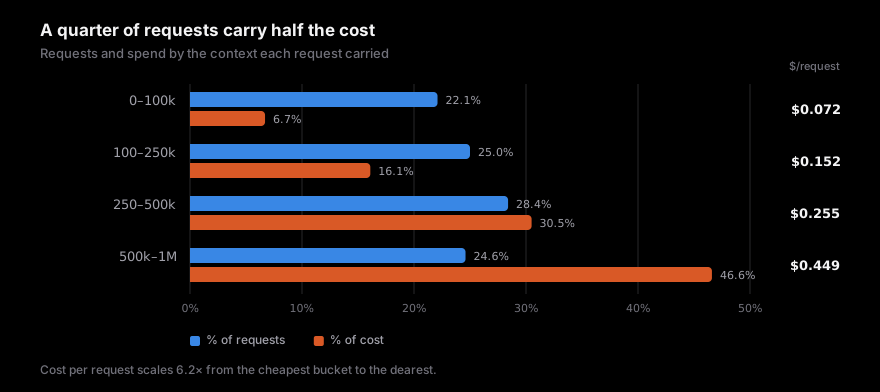
| Context / request | Requests | % of requests | Cost | % of cost | $/request |
|---|---|---|---|---|---|
| 0–100k | 2,835 | 22.1% | $205 | 6.7% | $0.072 |
| 100–250k | 3,206 | 25.0% | $488 | 16.1% | $0.152 |
| 250–500k | 3,640 | 28.4% | $926 | 30.5% | $0.255 |
| 500k–1M | 3,151 | 24.6% | $1,416 | 46.6% | $0.449 |
24.6% of requests carry more than 500k of context and account for 46.6% of all spend. Peak contexts reach 999,488 tokens; sessions run at the full 1M window and every subsequent request re-reads all of it.
The distribution is uniformly large: the p25 request already carries 111k tokens.
Sessions are distributed differently. Mean cost per session is 8.16 median**, and the top 9 of 47 sessions (19%) account for 76.1% of all spend. A budget cap that never fires below $50 leaves 72% of sessions untouched and sits in front of 89% of the money.
12,902 requests produced 820 handbacks to the user: 15.7 API requests per instruction, at $3.70 per handback. A per-turn payload optimisation is therefore divided by ~16 relative to a context-size optimisation, because the payload is re-sent on each of those requests.
3. Volume has no day-to-day regularity
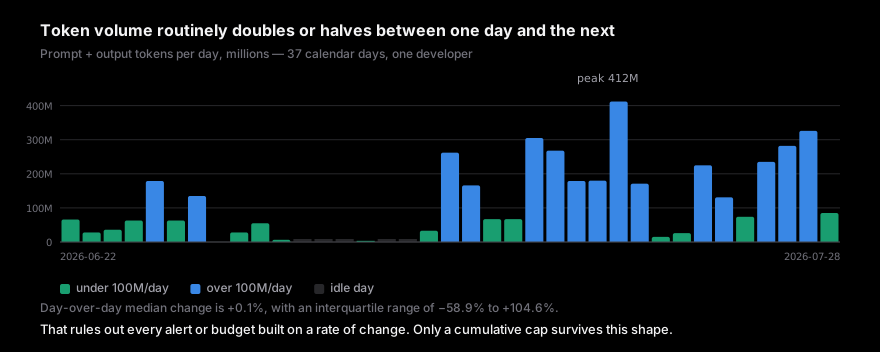
Day over day, the median change in token volume is +0.1%, with an interquartile range of −58.9% to +104.6%. The swing from week 1 to week 3 is 17.5×. Five of 37 calendar days are idle.
A 2× day sits inside the interquartile range, so any alert keyed on a day-over-day or week-over-week delta fires within normal variation. Cumulative measures — rolling spend against a period cap — do not have this property.
Tokens and commits are loosely coupled. 07-14 spent 47 for 15; 07-09 produced 106 commits on 33M tokens. Across the window: 11.1M tokens per commit, of which 28k are the model's own output. For every token generated, 395 tokens of context were read back in.
4. Where the tokens sit
The unit is token-turns — tokens × turns resident — because content in the context is re-read on every subsequent request, which is what cache-read billing is proportional to.
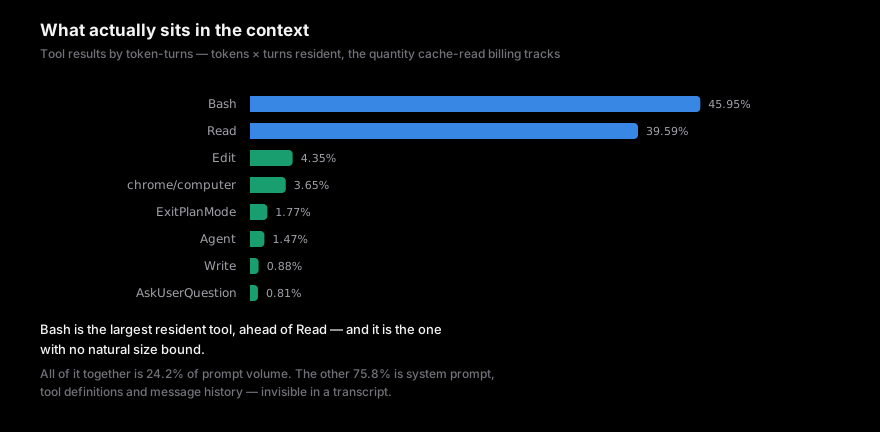
| Tool | Resident token-turns | Share |
|---|---|---|
Bash |
487,265,664 | 45.95% |
Read |
419,811,300 | 39.59% |
Edit |
46,134,368 | 4.35% |
chrome/computer |
38,729,141 | 3.65% |
ExitPlanMode |
18,816,234 | 1.77% |
Agent |
15,594,672 | 1.47% |
Write |
9,319,374 | 0.88% |
AskUserQuestion |
8,636,594 | 0.81% |
Bash is 51.6% of tool calls and averages 915 bytes per result — high-frequency and small — yet
it is the largest resident tool, ahead of Read, and the only one with no size bound on a single
result: one verbose test run or directory listing enters the context and is re-read on every
subsequent turn.
Tool results are 24.2% of prompt-token volume. The other 75.8% is system prompt, tool definitions and message history, none of which a transcript records. Every lever below reaches a quarter of the volume.
One live session was captured at the request-body level to measure that 75.8%. In that session tool definitions were ~80% of the assembled prompt — 64,029 bytes — against 12% system prompt and 9–11% messages. 27 tools were defined and 1 was used: 95.4% of the definition bytes were never touched. Definitions render first, so they sit at the head of the prefix and are re-read every turn. This is measurable only from request bodies, not from transcripts.
5. Four levers, measured
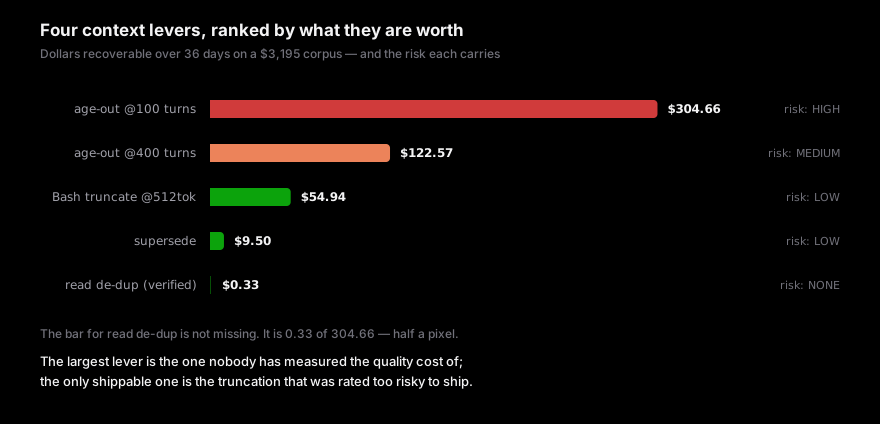
Four tail-side hygiene levers were specified — de-duplicate repeat reads, supersede stale results,
age out old content, truncate Bash output — then backtested individually against the corpus.
| Rank | Lever? | % of prompt tokens | $ | % of billed | Risk |
|---|---|---|---|---|---|
| 1 | age-out @100 turns | 17.19% | $304.66 | 9.53% | HIGH, unmeasured |
| 1c | age-out @400 turns | 7.45% | $122.57 | 3.84% | MEDIUM |
| 2 | Bash truncate @512 tok |
2.90% | $54.94 | 1.72% | LOW with head+tail |
| 3 | supersede | 0.67% | $9.50 | 0.30% | LOW |
| 4 | read de-dup (verified) | 0.03% | $0.33 | 0.01% | NONE |
Read de-duplication: measured at $0.33
The lever was specified on one statistic: 59% of file reads are re-reads of a file already read that session. That count reproduces at 57.1% here. The redundancy inference drawn from it does not hold.
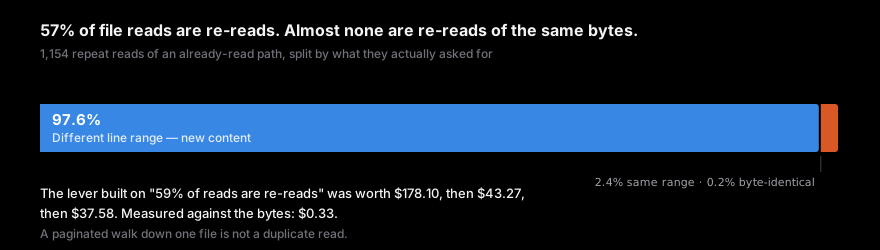
Of 2,022 Read calls with a path |
||
|---|---|---|
| First read of that path | 868 | 42.9% |
| Repeat read of an already-read path | 1,154 | 57.1% |
| → same line range (identical tool input) | 28 | 2.4% of repeats |
| → different line range (pagination, adjacent slice) | 1,126 | 97.6% of repeats |
| → byte-identical to an earlier read | 2 | 0.2% of repeats |
A repeat read of a file is rarely a repeat read of the same bytes. 97.6% of the re-reads are the agent requesting a different part of a file it had already opened — new content, which cannot be collapsed to a pointer. The largest figure in the original analysis, "73 reads of one file in one session", reproduces exactly and resolves to 73 different offsets into one large file. No identical range is re-read more than 4 times in any session in the corpus.
The cause was the fingerprint: a tool call was hashed on its file path alone. One session read a
1,119-line file at offset 1 limit 470, then offset 470 limit 450, then offset 920 limit 200
— three disjoint slices of a single walk. Scored as three reads of the same target, that walk
contributed $2.89 of "de-duplication value".
Keying on the whole tool input and requiring the bytes to already be resident moves the lever from 0.33. Measured across four passes: 43.27 → 0.33. At $0.33 over 36 days it does not cover the per-path staleness tracking it requires.
Bash truncation: the risk objection, tested
The lever was rated HIGH risk on the objection that Bash output is the signal — stack traces, test failures, grep hits — and a 2 KB cut removes most of a Python traceback.
Splitting the recovered value by whether the output's head carries a diagnostic (Traceback,
FAILED, assert, panic:, an error line):
| Cap | Dumps & listings | Diagnostics |
|---|---|---|
| 1024 tok | $19.90 (90%) | $2.15 (10%) |
| 512 tok | $49.30 (90%) | $5.63 (10%) |
| 256 tok | $87.24 (89%) | $10.29 (11%) |
Nine tenths of the value is in file dumps, grep roll-ups, diffs and linter summaries. The
risk sits in the other tenth and is separable two ways: retain head and tail, so a traceback's
exception line and final frame both survive; or exempt anything matching the diagnostic predicate,
which retains 90% of the value.
One call from turn 4 of a 1,317-turn session illustrates the residency effect: a command printing a
section of a document returned 16,756 chars ≈ 4,189 tokens and stayed resident for all 1,313
remaining turns — 5,500,157 token-turns, $2.75. A 512-token cap recovers $2.41 from that
one call, 7× the entire verified Read de-dup lever across 36 days.
The published ordering was inverted. Bash truncation is first by 166×; Read
de-duplication is last by two orders of magnitude.
Age-out carries most of the remaining value
Age-out — dropping tool results older than N turns — carries 71% of the balanced tier's value and 88% of the aggressive tier's. With de-dup and supersede corrected downward, the token-removal case rests on one parameter whose quality cost is unmeasured.
One measured instance: at turn 147 of a 1,317-turn session a whole-file Read returned 10,003
tokens. The file's name does not appear anywhere in the session after turn 198 — not in a tool
call, a result, or assistant text — and the session ran for another 1,118 turns.
| Read at turn | 147 |
| Last mention of the file, anywhere | 198 |
| Idle residency | 1,118 turns |
| Dead token-turns | 11,183,354 |
| Cost of that dead residency | $5.59 |
| Full residency cost from birth | $5.85 |
96% of that read's lifetime cost accrued after the agent had stopped referring to the file —
0.33 for the entire read de-dup lever across the
corpus.
The gap between a 400-turn window (304.66) is $182 — larger than every other lever combined. No session in this corpus was run with content removed, so the corpus contains no measurement of what a dropped result costs in task success. That experiment gates 71–88% of the remaining value.
6. The other axis: elapsed time
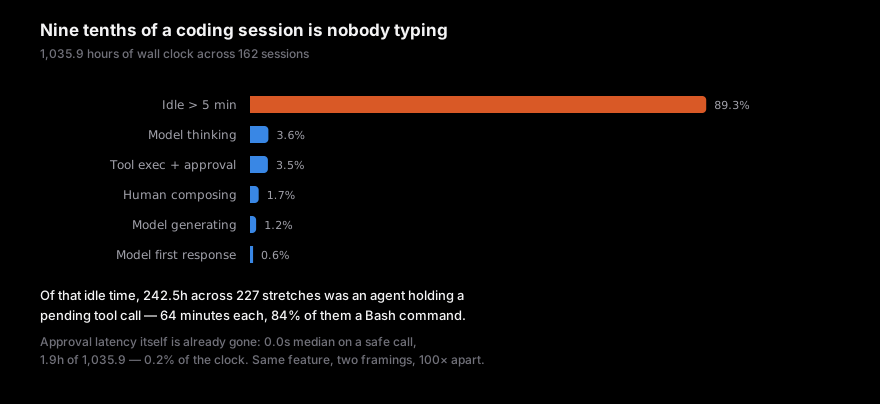
Measured over 162 sessions and 1,035.9 hours of wall clock:
| Phase | Hours | Share |
|---|---|---|
| Idle > 5 min | 925.6 | 89.3% |
| Model thinking after a tool | 37.0 | 3.6% |
| Tool execution + approval | 36.7 | 3.5% |
| Human composing a prompt | 17.6 | 1.7% |
| Model generating | 12.5 | 1.2% |
| Model first response | 5.9 | 0.6% |
| Active (excluding idle) | 110.3 | 10.7% |
Median session span is 10.7 minutes. 89.3% of elapsed session time is idle, so optimisations aimed at the active loop address 10.7% of the clock.
Splitting idle time by whether the agent held a pending tool call when it went quiet:
| Idle > 5 min | Hours | Occurrences | Mean |
|---|---|---|---|
| Parked on a pending tool call | 242.5 | 227 | 64 min |
| Idle for any other reason | 683.1 | 310 | — |
227 times, an agent held a tool call for an average of 64 minutes, totalling 26.2% of all idle
time. The pending call was Bash 190 times, AskUserQuestion 13, ExitPlanMode 9, Edit 5,
Agent 3, Read 2 — Bash is 84% of parked events. This is an upper bound, not a saving: a
transcript cannot distinguish a human who left for unrelated reasons while a call happened to be
pending from one who would have returned to an agent that had made progress.
Under this configuration, per-prompt approval latency is already near zero: median gap on a low-risk call is 0.0s, and low-risk gap time totals 1.9h against 1,035.9h — 0.2% of wall clock. Reducing keystroke latency addresses that 0.2%; eliminating hour-long parking addresses up to 23%.
7. Declined tool calls
A declined tool call is recorded verbatim — is_error: true carrying the string "The tool use was rejected" — which makes 14,786 calls a labelled dataset.
93 rejections in 14,786 calls — 0.63%.
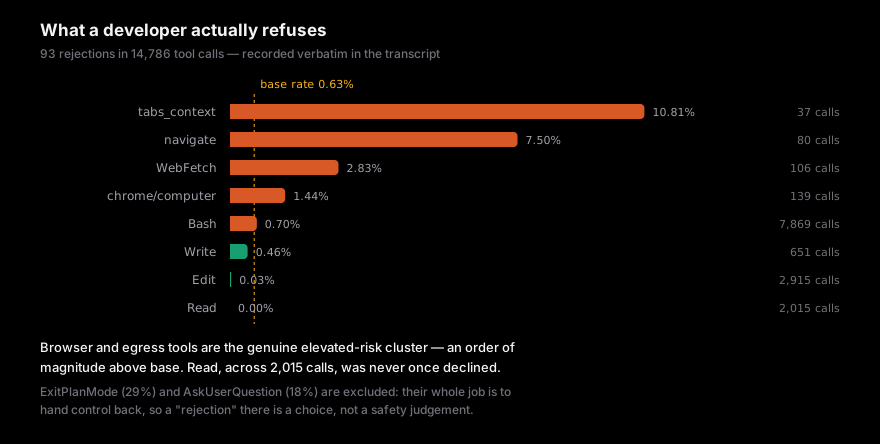
The highest-rate entries are not risk refusals. ExitPlanMode at 29% and AskUserQuestion at
18% are tools whose function is to hand control back; a rejection there means picking a different
option or continuing to plan. They have to be excluded from risk accounting.
Browser and egress tools form the elevated cluster — tabs_context 10.81%, navigate 7.50%,
WebFetch 2.83% — an order of magnitude above base rate. Read, across 2,015 calls, was never
declined.
Scored against that ground truth, a deterministic five-tier classifier that fails closed places 3,725 calls (25.2%) in a SAFE tier. Its raw rejection rate is 0.56%, of which 18 of 21 rejections are the control-flow tools above. Excluding those: 3 rejections in 3,640 calls — 0.082%, all three read-only commands where the refusal indicated the wrong file rather than a safety judgement. A deterministic SAFE tier covering a quarter of all tool calls therefore has an effective false-approve rate of 0.08% against real human decisions.
44.5% of calls land in UNPARSED — "ask" rather than "allow" — because shell commands are not
classifiable by their head: cat x > y writes; echo $(rm -rf .) deletes. 4,410 calls contain a
redirect or command substitution and 2,127 are compound commands with a non-safe stage. Draining
that bucket requires per-segment shell parsing.
8. Seven revisions, every one downward
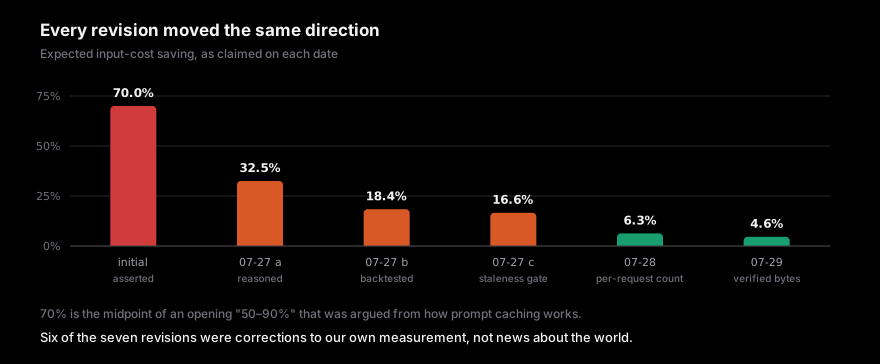
| Date | Claim | What changed it |
|---|---|---|
| initial | 50–90% input-cost cut | asserted from how prompt caching works |
| 2026-07-27 | 25–40% | Claude Code already caches well; 6.7× is banked before we arrive |
| 2026-07-27 | 18.4% | levers backtested instead of estimated |
| 2026-07-27 | 16.6% | 55.2% of repeat reads follow an Edit — naive de-dup served stale content |
| 2026-07-27 | ~5% usage headroom | a cost saving is not a token saving |
| 2026-07-28 | 6.3% expected / 3.4% floor | corpus re-extracted per API request |
| 2026-07-29 | ~4.6% expected / 1.7% floor | levers re-measured off raw transcripts |
Six of the seven revisions were corrections to the analysis rather than new information about the workload, and each has the same form: a proxy was measured instead of the quantity itself.
- Transcript records counted as API requests. Claude Code writes one transcript record per
content block and repeats the whole
usageobject on each, so a response containing[thinking, text, tool_use]is three records carrying identical prompt-token counts. Per-record summing overstated prompt volume 1.95× and output 2.34×. Every absolute halved: 3,035. - File paths counted as tool targets. A paginated walk registered as 73 duplicate reads.
- base64 length counted as image tokens. Charging
len(base64) / 4bills a 1451×840 JPEG at 27,878 tokens; Anthropic bills it at roughlyw·h/750≈ 1,625, a 17× overstatement. It also moved the denominator: tool results are 24.2% of prompt volume, not the 40.1% previously published.
The 2026-07-28 revision moved two conclusions rather than magnitudes. Duplicate records sit milliseconds apart carrying identical context, which is the signature the backtest classified as "prefix mutation" — the measurement was generating mutation events from its own duplicates. With them removed:
- Prefix mutation fell from 61.4% of cache loss (87.11)**.
- TTL expiry rose from 21.8% to 47.6% ($207.58), making it the largest single lever, at zero UX risk: refreshing a cache entry before it expires changes nothing the model sees.
The remaining 75.8% of context volume is measured by subtraction rather than observed, and is therefore subject to the same class of error.
9. Composed tiers
| Tier | What it contains | Cost | Tokens |
|---|---|---|---|
| FLOOR | Bash truncation + supersede |
1.7% | 2.93% |
| EXPECTED | + prefix-mutation fix | 4.6% | 2.93% |
| + TTL keep-alive | accounting only, removes zero tokens | ~11.4% | 2.93% |
| BALANCED | + age-out @400 turns | 13.4% | 8.1% |
| AGGRESSIVE | + age-out @100 + 256-tok cap | 19.8% | 18.8% |
%cost and %tokens are different units and do not track each other. TTL keep-alive and
mutation elimination are price conversion: the tokens that fell out of cache are still sent, but
are billed as reads (0.1×) instead of writes (2.0×) — same volume, ~20× cheaper. The levers
therefore rank differently by billing model:
| Team on API billing | Developer under a token cap | |
|---|---|---|
| TTL keep-alive | largest lever | no effect — conversion, not reduction |
| Mutation fix | modest | no effect |
| Tail-side hygiene | small | the only lever that reduces tokens |
The zero-risk lever is worth more than all validated tail-side hygiene combined, and the levers that remove tokens are the small ones.
Measured position today: Bash truncation at 512 tokens with head-and-tail retention and a
diagnostic exemption is ~9; age-out is 304.66 with an
unmeasured quality cost, pending a session replay with aged context.
Open blockers
| # | Blocker | What it gates |
|---|---|---|
| 1 | Message history and tool definitions not measurable from a transcript | the other 75.8% of context volume |
| 2 | Cause of prefix mutation unknown | $87 / 2.7% of cost |
| 3 | Tiering quality cost unmeasured | a 5× price spread on 67.3% of spend |
| 4 | Aging risk unquantified | 71–88% of all token removal |
| 5 | Single-client corpus | whether any of this generalises |
Blockers 1 and 2 resolve from the same experiment: one live session captured at the request-body level yields both the mutating field and the assembled prompt. That capture is what produced the tool-definitions finding in §4.
Measurement notes
Each of the following is a correction published against our own earlier figures, with the size of the error it produced.
- Count API requests, not transcript records. Summing
usageper record roughly doubles every total. Join onmessage.id. - Key tool calls on the whole input, not on the target. Otherwise pagination registers as duplication.
- Price images as images:
w·h/750, notlen(base64)/4— a 17× error that moves the denominator. - Verify redundancy against the bytes. "Same argument" is not "same content"; requiring byte-identity or verbatim containment moved the de-dup lever from 0.33.
- Measure the clock separately from the money. They decompose differently: 242 hours of agents parked on approval does not appear in any cost metric.
- Instrument the assembled prompt, not just the transcript. 75.8% of the volume is visible only there, and in the one capture it was dominated by tool definitions.
The instrument that produced all of this runs as a local sidecar on each developer's own machine — nothing uploaded, transcripts read but never written. Details in Announcing the ACE sidecar.