Preventing Production Performance Regressions: Dual-Axis Scorecards, Downstream AI Quality, and Goodput
How ACE guarantees zero ML product and feature regressions—protecting user experience, task resolution speed, tool schema fidelity, and useful token goodput—through continuous production performance monitoring.
The Central Question: "How Do You Make Sure There Is No Performance Regression?"
When AI platform and machine learning teams evaluate cost and throughput optimization skills—such as context compaction, semantic prompt caching, and intelligent model routing—the most critical blocker to enterprise adoption is always:
"How do you mathematically guarantee that enabling an optimization does not introduce an AI/ML product performance regression?"
Historically, AI gateways attempt to answer this question through one of two incomplete lenses:
- Infra-Only Lens: Monitoring gateway latency, memory usage, and HTTP 5xx error rates.
- Per-Request Proxy Lens: Measuring single-turn token savings or isolated Time-to-First-Token (TTFT) reductions.
Both approaches suffer from the "Micro-Optimization / Macro-Failure Paradox": an aggressive prompt compression algorithm may reduce input tokens by on a single isolated API call, but if it removes subtle instructions, a downstream agentic coding assistant or customer support workflow may require 6 turns instead of 2 turns to resolve the user's task. The net result is a explosion in cumulative cost, a increase in user waiting time, and a severely degraded experience.
To solve this, ACE formalizes the Dual-Axis Performance Regression Architecture:
┌─────────────────────────────────────────────────────────────────────────────────────────────────┐
│                    THE TWO DIMENSIONS OF GENAI PERFORMANCE REGRESSIONS                          │
├──────────────────────────────────────────────────┬──────────────────────────────────────────────┤
│ 1. System Performance, Reliability & Errors      │ 2. ML Quality, User Experience & Task Time   │
│    • Upstream 5xx/429 spikes & network timeouts  │    • Subtly degraded output reasoning        │
│    • Gateway CPU/memory latency overhead         │    • Broken code generation / JSON schemas   │
│    • Internal filter stalls & fail-open events   │    • Longer time to solve user/agent tasks   │
│    • Breaking client streaming connections       │    • Immediate client re-prompting loops     │
├──────────────────────────────────────────────────┼──────────────────────────────────────────────┤
│    SOLVED BY: Embedded Canaries & Auto-Revert   │    SOLVED BY: Dual-Axis Scorecards & Goodput │
│    (See Companion Post)                          │    (This Deep-Dive)                          │
└──────────────────────────────────────────────────┴──────────────────────────────────────────────┘
While canaries and circuit breakers protect against Dimension 1 (System Reliability and Outages), they cannot directly measure whether an AI model's output quality has subtly drifted or whether end-users are taking longer to complete multi-turn tasks.
This post details our architectural solution to Dimension 2: ML Product Quality, User Experience, and Task Completion Time: Dual-Axis Production Performance Monitoring, Multi-Turn Task Telemetry, and Useful Token Goodput.
1. Dual-Axis Architectural Paradigm
The ACE telemetry engine continuously bifurcates incoming production signals into two correlated operational axes:
                                  ┌─────────────────────────────────────────────────────────────┐
                                  │   "HOW DO WE GUARANTEE ZERO PERFORMANCE REGRESSION?"        │
                                  └──────────────────────────────┬──────────────────────────────┘
                                                                 │
                                 ┌───────────────────────────────┴──────────────────────────────┐
                                 ▼                                                              ▼
    ┌──────────────────────────────────────────────────────────┐   ┌──────────────────────────────────────────────────────────┐
    │                         AXIS 1                           │   │                          AXIS 2                          │
    │             SYSTEM & INFRASTRUCTURE HEALTH              │   │             ML PRODUCT & DOWNSTREAM AI QUALITY           │
    │   "Did we break the gateway, latency, or availability?"  │   │     "Did we degrade model intelligence, UX, or tasks?"   │
    └────────────────────────────┬─────────────────────────────┘   └────────────────────────────┬─────────────────────────────┘
                                 │                                                              │
         ┌───────────────────────┴───────────────────────┐              ┌───────────────────────┴───────────────────────┐
         ▼                                               ▼              ▼                                               ▼
  Deterministic Canary                           Auto Rollback   Task-Level Telemetry                    Goodput & Quality Invariants
  (Zero-Confounder A/B)                          Tripwires       (Turns, E2E Latency, Cost/Task)         (Goodput %, Goodput/$, Fidelity)
The Dual-Axis Evaluation Matrix:
| Metric Dimension | Axis 1: System & Infra Health | Axis 2: ML Product & Downstream AI Quality |
|---|---|---|
| Primary Focus | Gateway overhead, latency percentiles, error rates. | User task completion, intelligence retention, agent efficiency. |
| Unit of Analysis | Single HTTP Request / Response exchange. | Multi-Turn Session / Workflow / Task Goal. |
| Key Invariants | Gateway Overhead , Upstream Errors , Fail-open . | Turns/Task Delta , Cost/Task Delta , Tool Fidelity . |
| Efficiency Metric | Throughput (Raw Tokens / sec). | Goodput (Useful on-SLO tokens / sec & ). |
| Failure Mode Detected | Upstream 504 timeouts, gateway proxy crashes. | Agent loops, corrupted JSON schemas, customer friction retries. |
2. Multi-Turn Task Dynamics: Moving Beyond Single-Request Evals
Single-request metrics fail to capture the true cost and latency of autonomous agents (Cline, Hermes, Claude Code) and conversational products:
                    SINGLE REQUEST VIEW (Traditional)                   MULTI-TURN TASK VIEW (ACE Dual-Axis)
                 ┌────────────────────────────────┐                 ┌───────────────────────────────────────────────┐
                 │ Request #1:                    │                 │ Session / Task ID: `task-8492`                │
                 │ • Tokens Saved: -32%           │                 │ • Turns to Complete: 6 turns (vs 2 in control)│
                 │ • TTFT: 82ms                   │       ───►      │ • End-to-End Task Duration: 18.4s (vs 5.1s)   │
                 │ • Status: 200 OK               │                 │ • Total Cumulative Cost: $0.042 (vs $0.018)   │
                 │ (Looks great in isolation!)    │                 │ • Tool Call Retries: 3 JSON parse failures    │
                 └────────────────────────────────┘                 │    NET TASK REGRESSION: +133% Cost, +260% Time │
                                                                    └───────────────────────────────────────────────┘
Core Downstream Task Dynamics Monitored:
Turns to Task Completion (): A positive delta in treatment () indicates that prompt compaction or model routing confused the downstream assistant, requiring extra clarifying iterations.
End-to-End Task Wall-Clock Latency (): Measures total latency experienced by the human user or workflow orchestrator across all conversational turns.
Cumulative Cost per Task (): The true economic North Star: an optimization is only valid if .
3. Goodput: Measuring Useful On-SLO Intelligence
Traditional gateways evaluate efficiency using Raw Token Throughput (tokens/sec). But generating tokens quickly is useless if the output contains hallucinated JSON, syntax errors, or truncated answers.
ACE introduces Goodput—the rate and volume of useful, uncorrupted, on-SLO output tokens delivered to the client:
Where a request is valid iff:
- (no upstream HTTP errors)
- (no immediate re-prompts within with similarity)
- (structured outputs match required JSON schema)
- (no unexpected context window truncation)
Core Goodput Metrics:
- Goodput Ratio ():
- Goodput per Dollar ():
4. Live Dual-Axis Fleet Dashboard in ace-fleet
The ace-fleet developer console surfaces both operational axes side-by-side in real time:
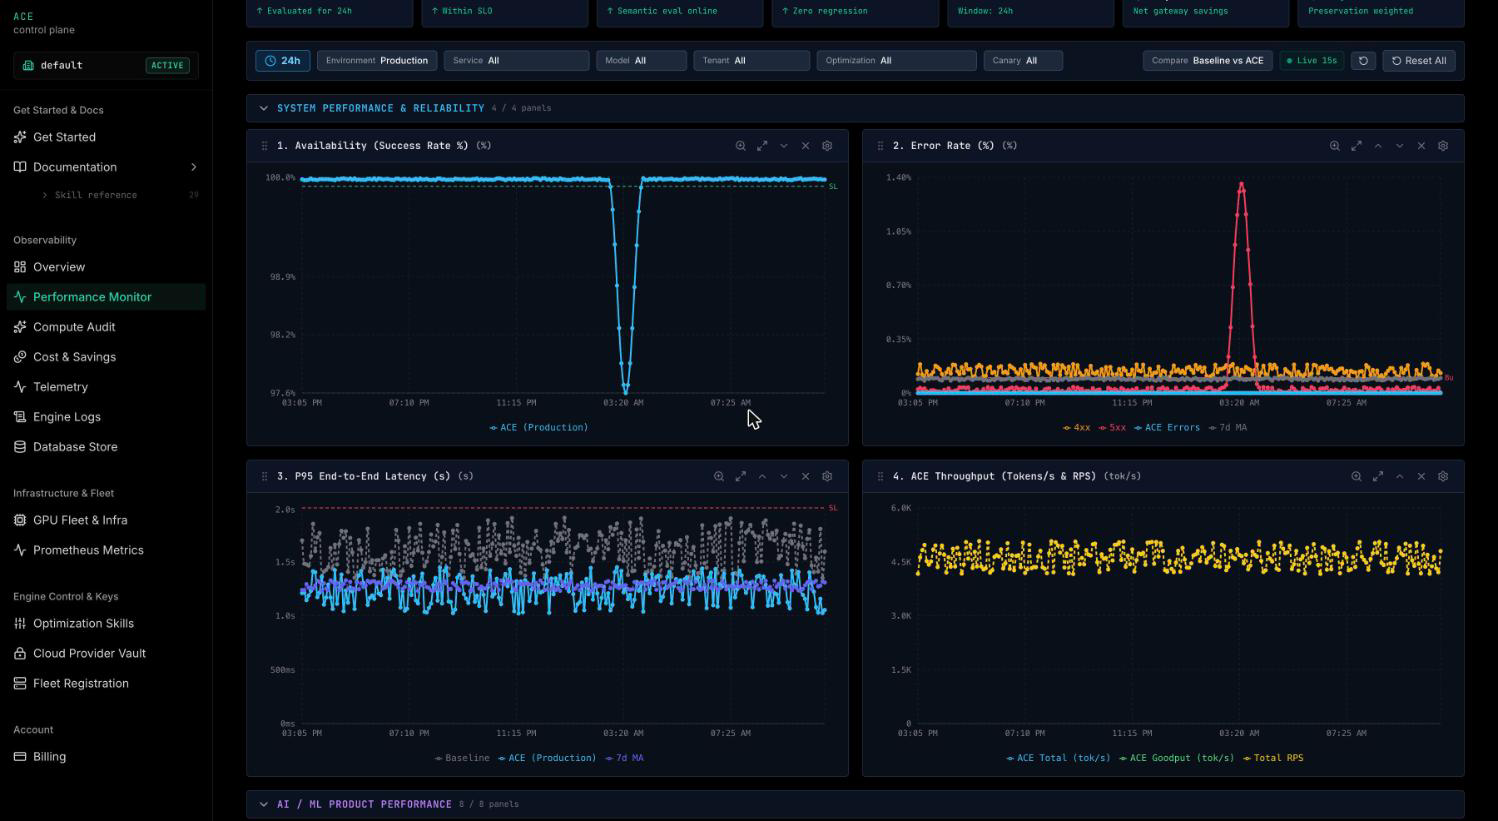
Axis 1 is the operational half: availability against its SLO floor, error rate split by class, P95 end-to-end latency with the ACE arm plotted against a concurrent baseline, and throughput. The dip visible mid-window is a single injected incident — availability falls below the floor and the 5xx series spikes in the same interval, which is the correlation an operator reads first.
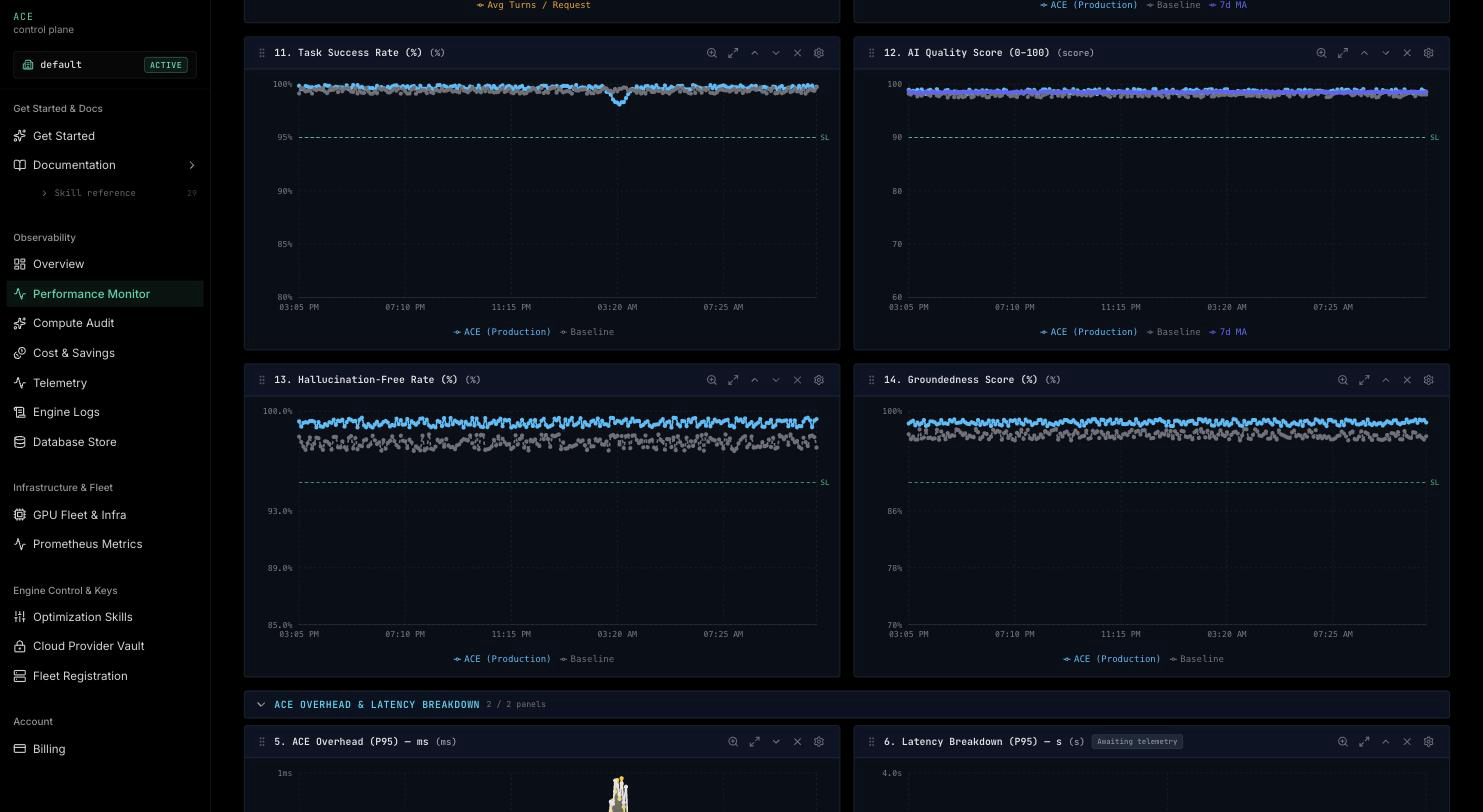
Axis 2 is the product half. The same window, the same baseline arm, but scored on what the application received rather than what the gateway did:
┌────────────────────────────────────────────────────────────────────────────────────────────────────────┐
│ DUAL-AXIS PERFORMANCE OVERVIEW · FLEET PRODUCTION BASELINE                                             │
├────────────────────────────────────────────────────┬───────────────────────────────────────────────────┤
│    AXIS 1 · SYSTEM & INFRASTRUCTURE HEALTH        │    AXIS 2 · ML PRODUCT QUALITY & GOODPUT          │
│ • Gateway Overhead (P95): +0.8 ms (Budget ≤ 15ms)  │ • Goodput Ratio: 100.0% (On-SLO Useful Tok)       │
│ • Net TTFT Delta: -19.6% vs Direct Control         │ • Goodput / $: 342,000 tok/$ Useful Delivered     │
│ • Upstream 5xx/429 Error Rate: 0.00%               │ • Turns / Task (N): 1.0 turns (Δ 0.0% vs Baseline)│
│ • Fail-Open Circuit Breaker: 0.00% (Armed)         │ • Tool Schema Fidelity: 100.0% (Valid JSON)       │
└────────────────────────────────────────────────────┴───────────────────────────────────────────────────┘
5. Domain-Specific Invariant Telemetry
In addition to fleet-wide Goodput and Task Dynamics, ACE continuously tracks deep domain invariants per skill:
┌──────────────────────────────┬────────────────────────────────────────────────────────────────────────┐
│ Skill                        │ Specific Production Invariants & Quality Signals                       │
├──────────────────────────────┼────────────────────────────────────────────────────────────────────────┤
│ semantic_cache               │ • Cache Hit Rate (%) & Retrieval Latency (P95 ms)                      │
│                              │ • Cache-Hit Retry Rate (Proxy for false-positive cache hits)           │
├──────────────────────────────┼────────────────────────────────────────────────────────────────────────┤
│ prompt_compaction            │ • Input Token Compression Ratio (%) & Compression Time / 1k Tokens     │
│                              │ • AST & Syntax Validation 400 Rate (Syntax corruption detector)        │
├──────────────────────────────┼────────────────────────────────────────────────────────────────────────┤
│ llm_router                   │ • Cheapest Tier Model Shift (%) & Model Quality Match Agreement        │
│                              │ • Model Escalation Rate (Retries demanding higher-tier models)         │
├──────────────────────────────┼────────────────────────────────────────────────────────────────────────┤
│ agent_trajectory_compaction  │ • Average Evicted Turn Depth & Tool Call Schema Survival Rate          │
│                              │ • Agent Multi-Turn Trajectory Length (Early session drop check)        │
├──────────────────────────────┼────────────────────────────────────────────────────────────────────────┤
│ injection_guard              │ • Stage 1 (Regex) vs Stage 2 (ONNX Classifier) Refusal Distribution    │
│                              │ • Over-Refusal Proxy (Immediate client re-submission after block)      │
├──────────────────────────────┼────────────────────────────────────────────────────────────────────────┤
│ speculative_decoding         │ • Draft Model Acceptance Rate α (%) & Generation Speedup (tokens/sec)  │
└──────────────────────────────┴────────────────────────────────────────────────────────────────────────┘
6. Programmatic Access: Dual-Axis Scorecard REST API
Query live dual-axis telemetry directly via REST to integrate with your enterprise observability pipelines:
GET /api/v1/tenant/org_enterprise/skills/prompt_compaction/scorecard?window=1h&key_id=dev_key_prod_01 HTTP/1.1
Host: gateway.ace.internal
Response (200 OK):
{
  "skill_id": "prompt_compaction",
  "current_mode": "canary:10",
  "window": "1h",
  "status": "HEALTHY",
  "sample_size": {
    "treatment": 4200,
    "control": 37800
  },
  "generic_metrics": {
    "gateway_overhead_p95_ms": 0.8,
    "ttft_p95_treatment_ms": 422.0,
    "ttft_p95_control_ms": 480.0,
    "ttft_delta_pct": -19.6,
    "upstream_error_rate_treatment": 0.0000,
    "upstream_error_rate_control": 0.0001,
    "client_retry_rate_treatment": 0.0040,
    "client_retry_rate_control": 0.0042,
    "fail_open_rate": 0.0
  },
  "downstream_ai_metrics": {
    "goodput_ratio_pct": 99.4,
    "goodput_per_dollar": 342000.0,
    "avg_turns_per_task": 1.8,
    "e2e_task_latency_p95_ms": 5200.0,
    "cost_per_task_usd": 0.0124,
    "tool_call_fidelity_rate": 1.0
  },
  "skill_specific_metrics": {
    "input_token_reduction_pct": 28.4,
    "compression_time_per_1k_ms": 1.8,
    "upstream_validation_400_rate": 0.0
  }
}
Summary
By pairing Axis 1 (System Infrastructure & Availability) with Axis 2 (ML Product Quality, Task Dynamics & Goodput), ACE eliminates the risk of silent production regressions. Teams can deploy aggressive cost and latency optimizations with absolute mathematical certainty that both the infrastructure and the downstream user experience are protected.
- Part 1: Embedded Canaries and Auto-Revert for System Reliability.
- Part 2: Dual-Axis Performance Scorecards and Goodput for ML Quality.